A reading is a measurement—and often an estimate
A wearable does not observe every aspect of health directly. It detects signals at the skin or records movement, then uses software to turn those signals into numbers and labels. Some figures are relatively direct measurements of a signal; others, such as sleep stages or a daily activity score, are estimates built from several signals. Knowing the difference makes a dashboard easier to interpret.
Many wrist devices estimate heart rate using light. A small light shines into the skin, and a sensor detects changes associated with blood flow as the heart beats. Some wearables also offer an electrical heart recording when the wearer activates a specific feature. That recording uses a different kind of signal and may require a particular hand position. Features and intended uses differ between products, so two devices with similar-looking screens may not be measuring in the same way.
What common wearable numbers describe
Steps and activity minutes usually come from motion sensors that detect movement and apply rules to classify it. They can be useful for seeing broad activity patterns, but arm movements may be counted as steps, while some walking may go uncounted if the arm stays still. Distance and energy-use figures generally add further estimates, which means they can change when settings or activity types change.
Some devices estimate blood oxygen saturation by comparing how different wavelengths of light interact with tissue. Others track skin temperature or changes from a personal temperature baseline. Skin temperature is not necessarily the same as a thermometer reading taken elsewhere on the body. Breathing rate, stress labels and sleep stages may also be inferred from combinations of movement, heart-related signals and other inputs rather than measured directly.
The name of a metric does not explain its method. A label such as “sleep” might mean time spent largely still, an estimated sleep period or a breakdown into predicted stages. Check the device’s description of each metric before comparing it with a different product or with a measurement made in another setting.
Why the same person can get different readings
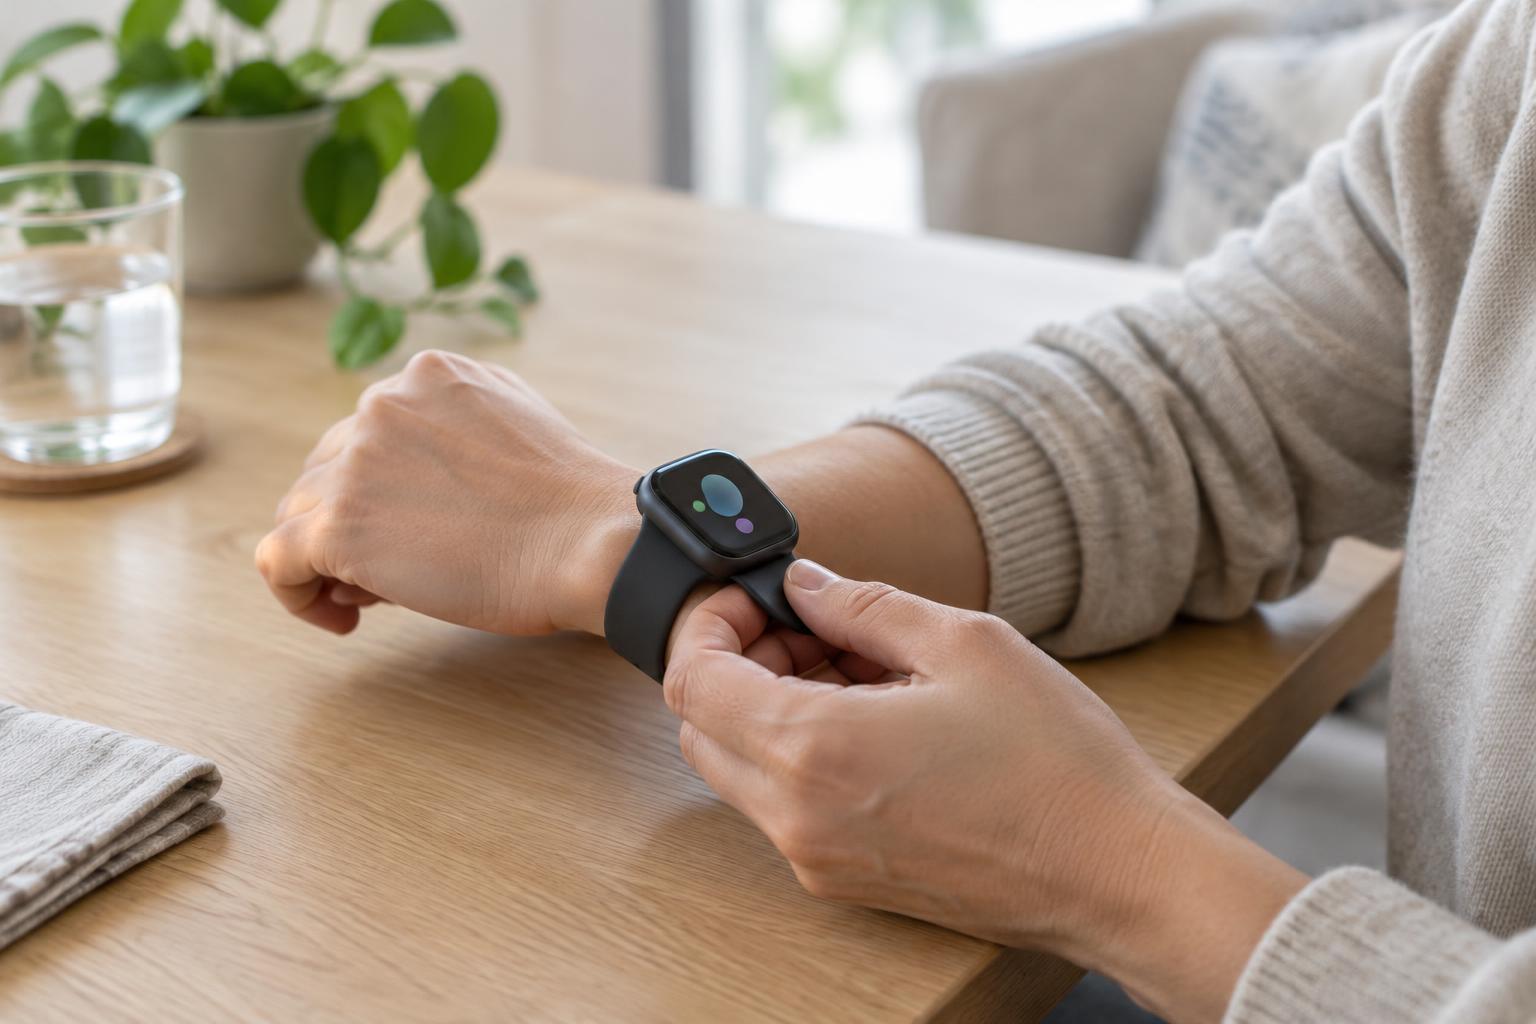
Sensor contact matters. A loose band can let light leak around an optical sensor or allow the device to shift during movement. A band worn too tightly may be uncomfortable without improving the measurement. Placement on the wrist, damp skin, lotions, hair and tattoos can also affect how well a sensor picks up a signal. Optical performance may vary across skin characteristics, and accuracy depends on the particular device and its design.
The surroundings and the activity matter too. Motion during exercise can make it harder for a wrist sensor to distinguish a pulse signal from movement. Cold conditions can alter blood flow near the skin. A reading taken while resting may therefore differ in reliability from one taken while carrying bags or cycling over rough ground. A brief gap or odd spike can reflect a difficult measurement rather than a sudden change in the body.
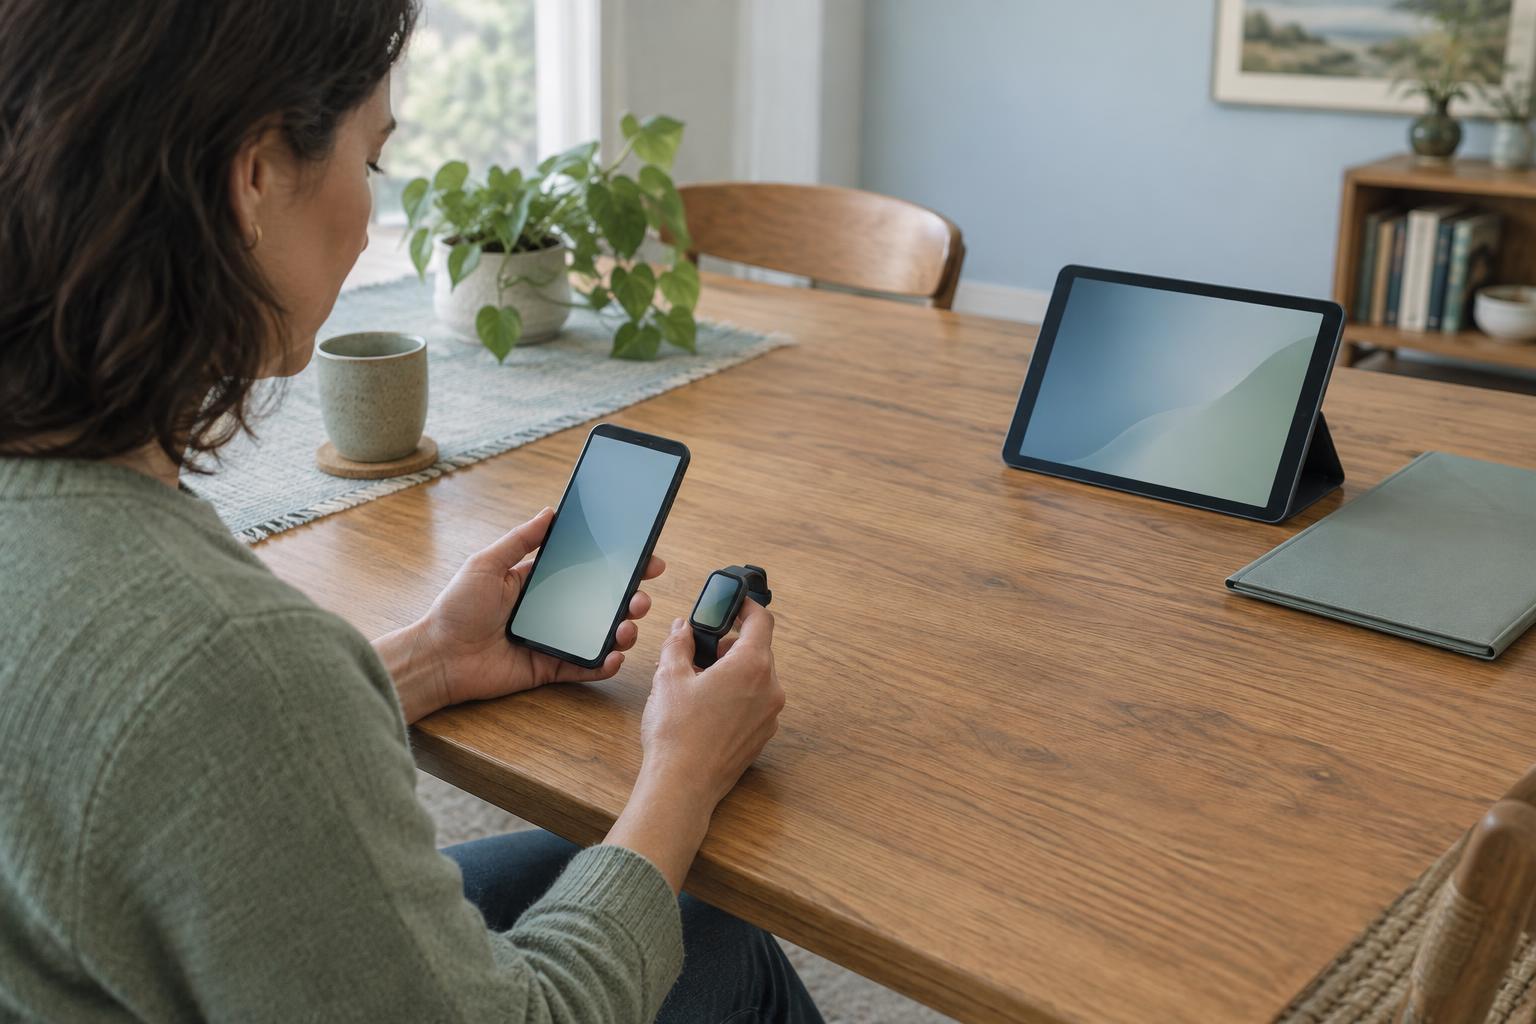
Finally, software makes choices. Devices may sample at different intervals, smooth a graph, discard readings they judge unreliable or update their calculations. A displayed value may represent an instant, an average or a past time window. Even two devices worn together can show different numbers because they collect and process signals differently.
Make the display easier to interpret
Start with the basics: confirm what the number represents, its units and when it was recorded. Look for missing periods before treating a chart as a continuous record. If a figure looks surprising, note whether the device had good contact and what you were doing at the time. These checks do not prove that a reading is right or wrong, but they provide useful context.
Trends can be more informative than an isolated point when conditions are reasonably consistent. Comparing readings from the same device at similar times and in similar circumstances may be easier than comparing numbers across brands. Even then, a trend is a prompt for questions, not an explanation of its cause. A wearable cannot determine what a symptom means simply because its chart changed—or stayed the same.
Use alerts and shared data thoughtfully
An alert is a notification based on the device’s rules, not a diagnosis. It may be worth checking the fit, timing and feature description before drawing conclusions from the number. If a reading or a physical symptom concerns you, a qualified health professional can help put it in context. Do not rely on a wearable alone to judge whether a concerning symptom needs attention.
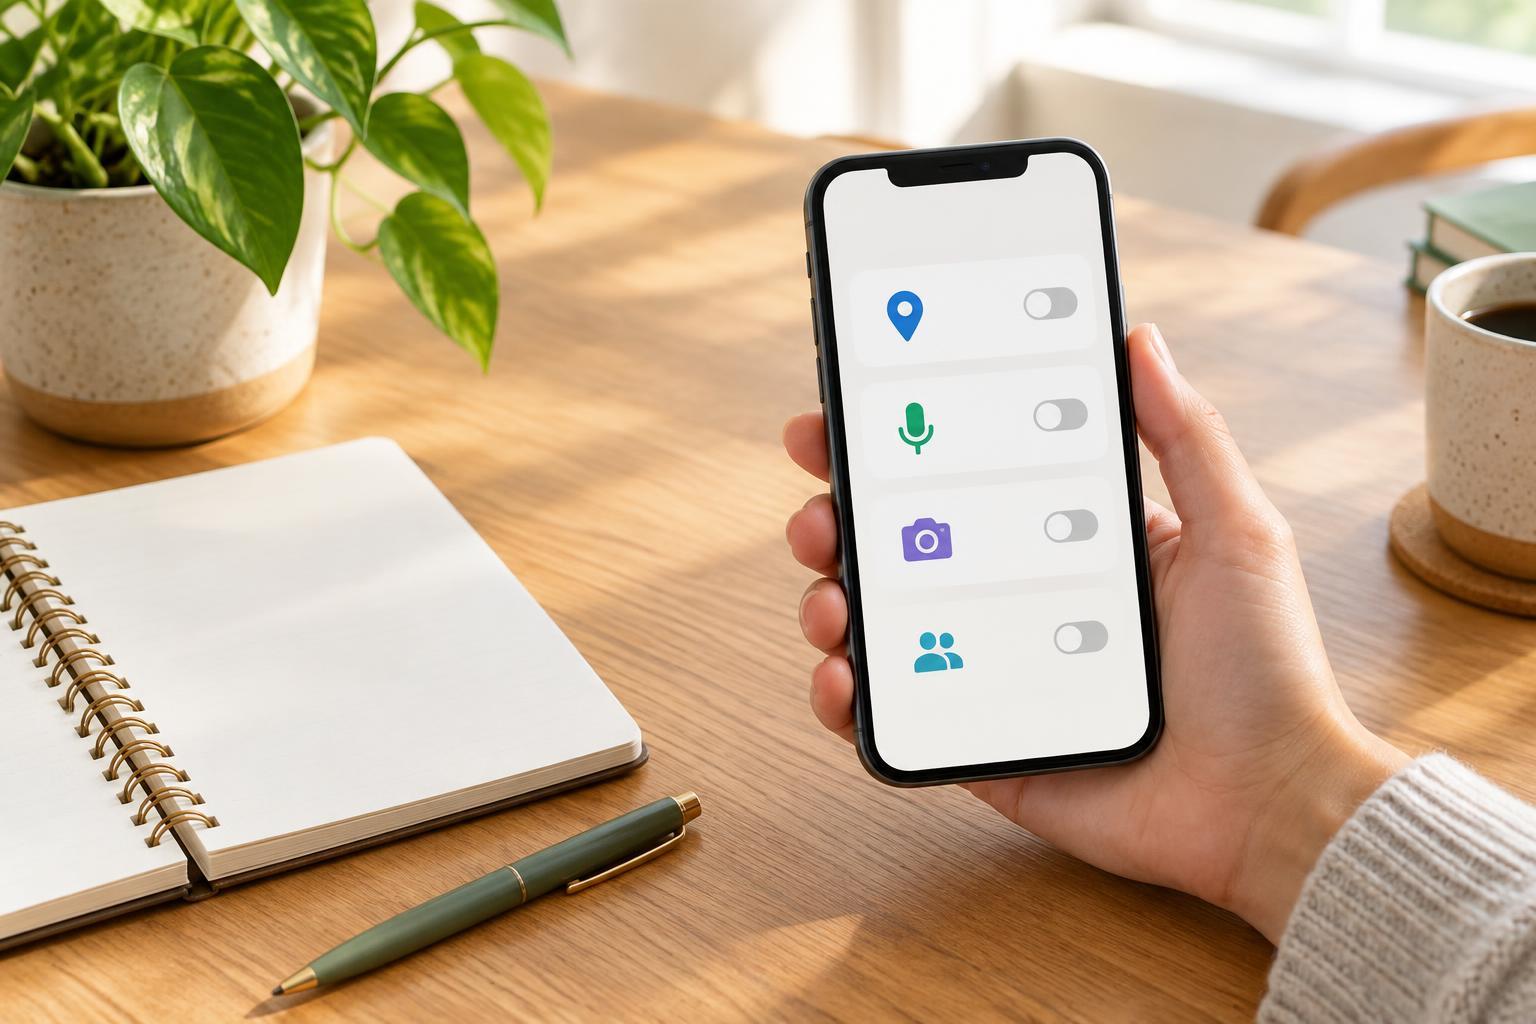
Wearable records can also be helpful for recalling approximate patterns when preparing for an appointment. A short note about the time, activity and reason a reading caught your eye may be clearer than handing over a long graph without context. Before sharing data, check what the app includes and who can access it. The most useful role for a wearable is often to support better questions, not to supply a final answer.